Underlying EPS increased by 6% with continued margin expansion and free cash flow generation of 11.3 billion USD
BRUSSELS--(BUSINESS WIRE)--Anheuser-Busch InBev (Brussel:ABI) (BMV:ANB) (JSE:ANH) (NYSE:BUD):
Regulated and inside information1
“Beer plays an important role in bringing people together and creating moments of celebration. In 2025, we executed our strategy, made disciplined capital allocation choices and delivered growth within our outlook for the year, even as we navigated a dynamic consumer environment. We exit 2025 with improved momentum and enter 2026 well positioned to engage consumers with our megabrands and an unparalleled lineup of mega platforms. Thank you to our colleagues for their ongoing commitment, hard work and passion for our business.” – Michel Doukeris, CEO, AB InBev
|
Revenue 4Q +2.5% | FY +2.0% Revenue increased by 2.5% in 4Q25 with revenue per hl growth of 4.0% and by 2.0% in FY25 with revenue per hl growth of 4.4%.
Reported revenue increased by 4.8% in 4Q25 to 15 555 million USD and decreased by 0.8% in FY25 to 59 320 million USD, impacted by unfavorable currency translation.
Volumes 4Q -1.5% | FY -2.3% Volumes declined by 1.5% in 4Q25, with beer volumes down by 1.9% and non-beer volumes up by 0.6%.
Volumes declined by 2.3% in FY25, with beer volumes down by 2.6% and non-beer volumes down by 0.4%.
Normalized EBITDA 4Q +2.3% | FY +4.9% Normalized EBITDA increased by 2.3% to 5 473 million USD in 4Q25, with a margin contraction of 10bps to 35.2%.
Normalized EBITDA increased by 4.9% to 21 223 million USD in FY25, with a margin expansion of 101 bps to 35.8%.
|
Underlying Profit 4Q 1 884 | FY 7 410 million USD Underlying Profit was 1 884 million USD in 4Q25 compared to 1 770 million USD in 4Q24 and was 7 410 million USD in FY25 compared to 7 061 million USD in FY24.
Reported profit attributable to equity holders of AB InBev was 1 959 million USD in 4Q25 compared to 1 220 million USD in 4Q24 and was 6 837 million USD in FY25 compared to 5 855 million USD in FY24.
Underlying EPS 4Q 0.95 | FY 3.73 USD Underlying EPS increased by 7.5% to 0.95 USD in 4Q25, compared to 0.88 USD in 4Q24, and increased by 6.0% to 3.73 USD in FY25, compared to 3.53 USD in FY24.
On a constant currency basis, Underlying EPS increased by 2.1% in 4Q25 and by 9.4% in FY25.
Net Debt to EBITDA 2.87x Net debt to normalized EBITDA ratio was 2.87x at 31 December 2025, compared to 2.89x at 31 December 2024. |
|
Capital Allocation Dividend 1.00 EUR The AB InBev Board of Directors proposes a final dividend of 1.00 EUR per share, subject to shareholder approval at the AGM on 29 April 2026. Combined with the interim dividend of 0.15 EUR per share paid in November 2025, the full year 2025 dividend would be 1.15 EUR per share. A timeline showing the ex-dividend, record and payment dates can be found on page 16.
As of 9 February 2026, we have completed approximately 635 million USD of the 6 billion USD share buyback program announced on 30 October 2025. |
|
The 2025 Full Year Financial Report is available on our website at www.ab-inbev.com.
|
1The enclosed information constitutes inside information as defined in Regulation (EU) No 596/2014 of the European Parliament and of the Council of 16 April 2014 on market abuse, and regulated information as defined in the Belgian Royal Decree of 14 November 2007 regarding the duties of issuers of financial instruments which have been admitted for trading on a regulated market. For important disclaimers and notes on the basis of preparation, please refer to page 18. |
Management comments
Continued earnings growth, margin expansion and solid free cash flow generation
In 2025, we continued to execute our strategy with discipline, delivering consistent financial performance while further strengthening the fundamentals of our business. Our teams remained focused on building great brands, operating efficiently and increasing our capital allocation flexibility. Momentum improved across many of our key markets in 4Q25 and we enter 2026 well positioned to engage consumers and accelerate growth.
Beer is a vibrant and resilient category, deeply connected to consumers across social occasions and embedded in culture. While near-term demand in some key markets was impacted by a constrained consumer environment and unseasonable weather, the long-term fundamentals and growth potential of the category remain unchanged. Our brands are iconic, our geographic footprint is advantaged, and our execution capabilities continue to strengthen.
The fundamentals of our business underpinned another year of solid financial performance. Revenue increased by 2.0%, with growth in 65% of our markets. Underlying EPS increased by 6.0% in USD and 9.4% in constant currency, and we maintained our solid free cash flow generation, delivering 11.3 billion USD. Disciplined revenue management and premiumization drove a revenue per hl increase of 4.4% and efficient overhead management supported an EBITDA margin expansion of 101bps.
Our ability to deliver consistent results across varying operating conditions is a testament to the durability of our strategy and the resilience of our business.
Progressing our strategic priorities
-
Lead and grow the category
In FY25, we invested 7.4 billion USD in sales and marketing behind our megabrands, mega platforms and brand building capabilities to lead the long-term growth of the industry. The beer and Beyond Beer category is forecast to continue to gain share of alcohol beverages globally in FY25, with further growth projected over the next 5 years, according to IWSR. We estimate we gained or maintained market share in two thirds of our markets, with our megabrands leading our growth with a 4.1% revenue increase.
Our portfolio of brands is unparalleled. We hold 20 iconic billion-dollar revenue beer brands and 8 out of the top 10 most valuable beer brands in the world, with Corona and Budweiser remaining the #1 and #2, according to Kantar BrandZ. In Beyond Beer, we are investing to fuel the momentum behind fast growing brands such as Cutwater, Nutrl, Flying Fish and Brutal Fruit. Our mega platform approach is a core element of how we build brands effectively at scale. Our activations in some of the largest consumer moments such as the Super Bowl, NBA, FIFA Club World Cup, Wimbledon, Roland Garros and Lollapalooza were a key contributor to our portfolio brand power reaching a record high in 2025. Our marketing effectiveness and creativity were recognized by being named the most effective marketer in the world by both Effies and the World Advertising Research Center for the fourth consecutive year.
Driven by performance across each of the category expansion levers and participation gains in Corona, Beyond Beer and our no-alcohol beer brands, we estimate that the number of legal drinking age consumers purchasing our portfolio increased versus FY24. - Core Superiority: Our mainstream beer portfolio accounted for approximately 50% of our FY25 revenue and delivered flattish revenue growth year-on-year, with growth in Africa, Middle Americas and South America offset by a soft industry in Europe and North America.
- Premiumization: We are the global leader in premium and super premium beer. Our above core beer portfolio accounted for 35% of our FY25 revenue and grew revenue by low-single digits. Corona led our performance, increasing revenue by 8.3% outside of Mexico with double-digit volume growth in 30 markets. In the US, Michelob Ultra was the #1 volume share gainer and is now the leading brand by volume in the industry. In Brazil, our premium and above portfolio continued to gain share and now leads the premium segment.
- Balanced choices: Growth in FY25 was driven by our no-alcohol beer portfolio which delivered a 34% revenue increase. No-alcohol beer performance was led by Corona Cero which grew volumes by strong double-digits. We are the leader in no-alcohol beer in many of our key markets, including the US, Canada, Brazil, Mexico, Colombia and Belgium, and see significant headroom for future growth. Our overall balanced choices portfolio of low carb, sugar free, gluten free and no-alcohol beer brands delivered a revenue increase of 8.9%.
- Beyond Beer: The growth of our Beyond Beer portfolio accelerated in FY25, increasing revenue by 23% and now representing 3% of our total revenue. Performance was led by Cutwater in the US, which grew revenue by triple-digits and was the #1 share gaining brand in the total spirits industry in 4Q25, and Brutal Fruit and Flying Fish which were expanded to new markets across Africa, Europe and Latin America.
-
Digitize and monetize our ecosystem
We continued to progress our digital transformation by expanding the availability and usage of BEES, accelerating the growth of BEES Marketplace and scaling our digital DTC solutions. - Digitizing our relationships with our more than 6 million customers globally: As of 31 December 2025, BEES was live in 29 markets, with 72% of our revenues captured through B2B digital platforms. In FY25, BEES captured 52.5 billion USD in GMV, growth of 12% versus FY24.
- Monetizing our route-to-market: The growth of BEES Marketplace GMV accelerated in FY25, increasing by 61% versus FY24 to reach 3.5 billion USD from sales of third-party products. Growth was led by the expansion of the asset-light 3P model from which GMV approximately tripled year-over-year.
- Leading the way in direct-to-consumer (‘DTC’) solutions: Our DTC ecosystem of digital and physical products generated revenue of 1.3 billion USD this year. Zé Delivery, TaDa Delivery and PerfectDraft generated over 76 million e-commerce orders and delivered 550 million USD of revenue in FY25, growth of 8% versus FY24.
- Optimize our business
-
Maximizing value creation: The continued optimization of our business enabled us to increase our sales and marketing investments, strengthen our balance sheet through bond repurchases and redemptions, increase returns to our shareholders, and pursue accretive bolt-on acquisitions.
Efficient resource allocation and overhead management more than offset transactional FX headwinds to drive EBITDA margin expansion of 101bps. USD EBITDA growth, balanced net working capital management and lower net finance costs delivered another year of solid free cash flow generation with 11.3 billion USD, consolidating the step-change delivered in FY24.
We continued to proactively manage our debt portfolio with bond repurchases and redemptions of 6 billion USD and issuances of 3.2 billion Euro, strengthening our debt maturity profile while maintaining our average coupon with our net debt to EBITDA ratio reaching 2.87x as of 31 December 2025.
The AB InBev Board of Directors has proposed a final dividend of 1.00 EUR per share, which combined with the interim dividend of 0.15 EUR per share, represents a 15% increase versus FY24, with the ambition to continue a progressive dividend over time. In addition, as of 9 February 2026 we have completed 635 million USD of our 6 billion USD share buyback program announced on 30 October 2025. -
Advancing our sustainability priorities: In 2025, we closed the sustainability goals we set in 2018 and we are proud of the goals we achieved and progress made on those we continue to work towards. Since 2017, we reduced our absolute GHG emissions across Scopes 1 and 2 by 44% and GHG emissions intensity across Scopes 1, 2 and 3 by 32%. We increased our percentage of operational renewable electricity by 67 percentage points since 2018 to 84%. In sustainable agriculture, 100% of our direct farmers met our criteria for being skilled, connected and financially empowered. In water stewardship, 100% of sites in scope of our goal recorded measurable improvement in watershed health and our global water use efficiency ratio reached 2.38 hl/hl, a 23% improvement versus our 2017 baseline. For circular packaging, 89.7% of our products were in packaging that was returnable or made from majority recycled content in 2025.
Please refer to our Sustainability Statements in our 2025 annual report here for further details, including how our metrics are calculated and the related assumptions.
Delivering reliable compounding growth
A central objective of our strategy is to deliver reliable compounding growth over time. While each year will have unique dynamics, our focus remains on consistent progress across the 3 pillars of our strategy to drive long-term value creation.
Since FY21, we have increased our revenue by 5 billion USD, EBITDA by 2 billion USD and free cash flow by 2 billion USD. Our Underlying EPS has increased by a CAGR of 6.7% in USD. Our financial performance has been consistent, with organic EBITDA growth within or above our medium-term growth outlook in every year. We have been disciplined in our capital allocation choices, reducing net debt by 15.3 billion USD to reach 2.87x net debt to EBITDA, progressively increased our dividend each year, including the payment of an interim dividend in 2025, completed 3.2 billion USD of share buybacks, and are currently executing a further 6 billion USD program.
The consistency of our financial performance is a reflection of our deliberate choices, clear strategic priorities and the unwavering commitment of our people to best-in-class execution.
Looking forward
We remain confident in the long-term potential of the beer category, which has structural tailwinds for growth and plays an important role in bringing people together and creating moments of celebration. The progress we have made in executing our strategy has driven consistent financial performance, increased our capital allocation flexibility and enabled increased returns to our shareholders while continuing to deleverage. We enter 2026 in a position of strength, with a highly engaged team, improved momentum across many of our key markets and with an unparalleled portfolio and lineup of mega platforms. From the Super Bowl to the Winter Olympics to the FIFA World Cup to our partnership with Netflix and, as from 2027, our sponsorship of the UEFA Men's Club Competitions, including the UEFA Champions League, we are uniquely positioned to engage consumers and activate the category. In closing, we would like to thank our colleagues around the world for their hard work, commitment, and passion, which continue to underpin our progress and performance.
2026 Outlook
(i) Overall Performance: We expect our EBITDA to grow in line with our medium-term outlook of between 4-8%. The outlook for FY26 reflects our current assessment of inflation and other macroeconomic conditions.
(ii) Net Finance Costs: Net pension interest expenses and accretion expenses are expected to be in the range of 190 to 220 million USD per quarter, depending on currency and interest rate fluctuations. We expect the average gross debt coupon in FY26 to be approximately 4%.
(iii) Effective Tax Rate (ETR): We expect the normalized ETR in FY26 to be in the range of 26% to 28%. The ETR outlook does not consider the impact of potential future changes in legislation.
(iv) Net Capital Expenditure: We expect net capital expenditure of between 3.5 and 4.0 billion USD in FY26.
|
Figure 1. Consolidated performance |
|||||||||
|
in USD Mio, except EPS in USD per share and Volumes in thousand hls |
4Q24 |
4Q25 |
Organic |
||||||
|
growth |
|||||||||
|
Volumes |
141 829 |
|
139 166 |
|
(1.5 |
)% |
|||
|
Beer |
121 052 |
|
119 039 |
|
(1.9 |
)% |
|||
|
Non-Beer |
20 777 |
|
20 127 |
|
0.6 |
% |
|||
|
Revenue |
14 841 |
|
15 555 |
|
2.5 |
% |
|||
|
Gross profit |
8 197 |
|
8 613 |
|
2.5 |
% |
|||
|
Gross margin |
55.2 |
% |
55.4 |
% |
(1)bps |
||||
|
Normalized EBITDA |
5 245 |
|
5 473 |
|
2.3 |
% |
|||
|
Normalized EBITDA margin |
35.3 |
% |
35.2 |
% |
(10)bps |
||||
|
Normalized EBIT |
3 824 |
|
4 049 |
|
4.5 |
% |
|||
|
Normalized EBIT margin |
25.8 |
% |
26.0 |
% |
49bps |
||||
|
|
|||||||||
|
Profit attributable to equity holders of AB InBev |
1 220 |
|
1 959 |
|
|||||
|
Underlying Profit |
1 770 |
|
1 884 |
|
|||||
|
|
|||||||||
|
Basic EPS |
0.61 |
|
0.99 |
|
|||||
|
Underlying EPS |
0.88 |
|
0.95 |
|
|
||||
|
FY24 |
FY25 |
Organic |
|||||||
|
growth |
|||||||||
|
Volumes |
575 706 |
|
561 100 |
|
(2.3 |
)% |
|||
|
Beer |
496 354 |
|
484 187 |
|
(2.6 |
)% |
|||
|
Non-Beer |
79 352 |
|
76 914 |
|
(0.4 |
)% |
|||
|
Revenue |
59 768 |
|
59 320 |
|
2.0 |
% |
|||
|
Gross profit |
33 024 |
|
33 179 |
|
3.4 |
% |
|||
|
Gross margin |
55.3 |
% |
55.9 |
% |
78bps |
||||
|
Normalized EBITDA |
20 958 |
|
21 223 |
|
4.9 |
% |
|||
|
Normalized EBITDA margin |
35.1 |
% |
35.8 |
% |
101bps |
||||
|
Normalized EBIT |
15 462 |
|
15 854 |
|
7.0 |
% |
|||
|
Normalized EBIT margin |
25.9 |
% |
26.7 |
% |
126bps |
||||
|
|
|||||||||
|
Profit attributable to equity holders of AB InBev |
5 855 |
|
6 837 |
|
|||||
|
Underlying Profit |
7 061 |
|
7 410 |
|
|||||
|
|
|||||||||
|
Basic EPS |
2.92 |
|
3.45 |
|
|||||
|
Underlying EPS |
3.53 |
|
3.73 |
|
|
||||
|
Figure 2. Volumes |
||||||||||||||||
|
in thousand hls |
4Q24 |
Scope |
Organic growth |
4Q25 |
Organic growth |
|||||||||||
|
Total |
Beer |
|||||||||||||||
|
North America |
19 516 |
(216 |
) |
(681 |
) |
18 619 |
(3.5 |
)% |
(5.5 |
)% |
||||||
|
Middle Americas |
38 907 |
(300 |
) |
1 065 |
|
39 672 |
2.8 |
% |
2.0 |
% |
||||||
|
South America |
44 950 |
- |
|
(1 791 |
) |
43 160 |
(4.0 |
)% |
(3.7 |
)% |
||||||
|
EMEA |
24 883 |
(15 |
) |
(619 |
) |
24 249 |
(2.5 |
)% |
(2.4 |
)% |
||||||
|
Asia Pacific |
13 439 |
1 |
|
(106 |
) |
13 334 |
(0.8 |
)% |
(0.8 |
)% |
||||||
|
Global Export and Holding Companies |
135 |
- |
|
(4 |
) |
131 |
(2.7 |
)% |
(2.7 |
)% |
||||||
|
AB InBev Worldwide |
141 829 |
(529 |
) |
(2 135 |
) |
139 166 |
(1.5 |
)% |
(1.9 |
)% |
||||||
|
FY24 |
Scope |
Organic growth |
FY25 |
Organic growth |
||||||||||||
|
Total |
Beer |
|||||||||||||||
|
North America |
86 272 |
(961 |
) |
(2 577 |
) |
82 734 |
(3.0 |
)% |
(3.9 |
)% |
||||||
|
Middle Americas |
150 086 |
(351 |
) |
755 |
|
150 490 |
0.5 |
% |
0.4 |
% |
||||||
|
South America |
160 768 |
- |
|
(5 597 |
) |
155 171 |
(3.5 |
)% |
(3.8 |
)% |
||||||
|
EMEA |
93 804 |
147 |
|
(629 |
) |
93 323 |
(0.7 |
)% |
(0.7 |
)% |
||||||
|
Asia Pacific |
84 397 |
(91 |
) |
(5 306 |
) |
78 999 |
(6.3 |
)% |
(6.2 |
)% |
||||||
|
Global Export and Holding Companies |
380 |
(9 |
) |
13 |
|
383 |
3.4 |
% |
3.4 |
% |
||||||
|
AB InBev Worldwide |
575 706 |
(1 265 |
) |
(13 341 |
) |
561 100 |
(2.3 |
)% |
(2.6 |
)% |
||||||
Key Markets Performance
United States: Building momentum and gaining market share in beer and spirits driven by Michelob Ultra and Cutwater
-
Operating performance:
- 4Q25: Revenue declined by 1.4% with revenue per hl increasing by 2.6% driven by revenue management and premiumization. Sales-to-retailers (STRs) declined by 3.5%, estimated to have outperformed a soft industry. Sales-to-wholesalers (STWs) declined by 3.9%. EBITDA decreased by 6.2%, impacted by phasing of sales and marketing investments.
- FY25: Revenue declined by 1.3%, with revenue per hl increasing by 2.0%. STRs declined by 3.2%, estimated to have outperformed the industry. STWs were down by 3.2%. EBITDA margin improved by 29bps, resulting in flattish EBITDA of -0.4% as we increased sales and marketing investments.
- Commercial highlights: Our market share momentum continued in FY25, with share gains in beer and the spirits-based ready-to-drink category, according to Circana. Our beer performance was led by Michelob Ultra, the leading brand by volume in the industry and the #1 volume share gainer, and Busch Light, which continued to be the #2 volume share gainer in the industry. In Beyond Beer, our portfolio momentum accelerated, with revenue growth in the high-thirties, led by Cutwater which grew revenue in the triple digits and was the #1 share gaining brand in the total spirits industry in 4Q25. We strengthened our leadership position in no-alcohol beer, with our portfolio gaining share and growing revenue by high-twenties. We are leading the industry in innovation, with Michelob Ultra Zero and Busch Light Apple the top 2 innovations in beer in FY25. Consistent execution, market share gains, and productivity initiatives enabled us to offset a soft industry and increase our sales and marketing investments to fuel momentum.
Mexico: Market share gain and margin expansion drove mid-single digit top- and bottom-line growth
-
Operating performance:
- 4Q25: Revenue increased by mid-single digits, with low-single digit revenue per hl growth driven by revenue management. Our volumes increased by low-single digits, outperforming an improved industry. Disciplined revenue management and productivity initiatives offset transactional FX headwinds to deliver mid-single digit EBITDA growth.
- FY25: Revenue grew by mid-single digits with revenue per hl growth of mid-single digits and flat volumes, outperforming the industry. EBITDA grew by mid-single digits with margin expansion.
- Commercial highlights: Our business continued to gain share of the industry in FY25. Our performance was led by our above core beer portfolio, which grew revenue by high-single digits driven by Modelo and Pacifico. We gained share of no-alcohol beer and, as of 3Q25, are the industry leader, with Corona Cero growing volume by strong double-digits. We continue to progress our digital initiatives, with BEES Marketplace growing GMV by 29% versus FY24 and our digital DTC platform, TaDa Delivery, fulfilling 4.2 million orders, a 3% increase versus FY24.
Colombia: Record high volume and margin expansion drove double-digit bottom-line growth
-
Operating performance:
- 4Q25: Revenue increased by high-single digits with high-single digit revenue per hl growth, driven by revenue management and positive mix. Volumes grew by low-single digits. EBITDA grew by mid-teens with margin expansion driven by disciplined cost management and operational leverage.
- FY25: Revenue grew by high-single digits with high-single digit revenue per hl growth. Volumes increased by low-single digits, estimated to be in-line with the industry. EBITDA grew by low-teens with margin expansion.
- Commercial highlights: Driven by the consistent execution of our category expansion levers, the beer industry continued to grow in FY25 with our volumes reaching a new record high. Revenue increased across all price segments of our portfolio, with our above core beer brands leading our performance with mid-teens revenue growth.
Brazil: Improved momentum in 4Q25 with market share gain driven by our premium portfolio
-
Operating performance:
- 4Q25: Revenue increased by 2.8% with revenue per hl growth of 6.8%, driven by revenue management and premiumization. Beer volumes declined by 2.8%, estimated to have outperformed the industry, with our volumes returning to growth in December as weather conditions normalized. Non-beer volumes decreased by 6.1%, resulting in a total volume decline of 3.7%. EBITDA increased by 5.1% with margin expansion of 78bps.
- FY25: Revenue grew by 1.0% with revenue per hl growth of 5.4%. Beer volumes declined by 4.6%, estimated to be in-line with the industry which was impacted by unseasonable weather and a soft consumer environment. Non-beer volumes declined by 2.9%, resulting in a total volume decline of 4.1%. EBITDA increased by 6.1% with margin expansion of 165bps as disciplined revenue management and productivity initiatives more than offset transactional FX headwinds.
- Commercial highlights: Our premium and super premium beer brands led our performance in FY25, delivering high-teens volume growth and estimated to have gained market share to now lead the premium segment. Our mainstream volume trend improved sequentially in 4Q25 as weather conditions normalized, estimated to have gained share of the segment in the quarter. Our portfolio of balanced choices drove incremental growth, with volumes of our no-alcohol beer brands increasing by 30% in FY25. In non-beer, our low- and no-sugar portfolio continued to outperform, delivering mid-twenties volume growth. We continue to progress our digital initiatives, with BEES Marketplace growing GMV by 78% versus FY24, and our digital DTC platform, Zé Delivery, generating approximately 67 million orders.
Europe: Continued market share gains and premiumization partially offset a soft industry
-
Operating performance:
- 4Q25: Revenue declined by high single digits with a revenue per hl decrease of low-single digits, impacted by phasing of promotional activities and negative channel mix. Volumes declined by high-single digits, as estimated market share gains in the majority of our key markets were offset by a soft industry and October shipment phasing. EBITDA declined by mid-twenties impacted by top-line performance and increased sales and marketing investments ahead of the Milano Cortina 2026 Winter Olympics.
- FY25: Revenue declined by low-single digits with flattish revenue per hl. Volumes declined by low-single digits, estimated to have gained market share in 5 of our 6 of our key markets. EBITDA declined by low-single digits with flat EBITDA margin.
- Commercial highlights: The beer category was estimated to have gained share of alcohol beverages across our key markets in FY25. We continued to premiumize our portfolio and increase our overall brand power, with our premium and super premium brands making up approximately 61% of our FY25 revenue. Our performance this year was driven by our megabrands, led by Corona, which delivered mid-single digit volume growth, and Stella Artois. We successfully completed the integration of San Miguel into our UK portfolio, becoming the leading brewer in the UK. Led by Corona Cero, the momentum of our no-alcohol beer portfolio continued, delivering mid-twenties volume growth and gaining share in key markets such as the Netherlands, France and Italy.
South Africa: Continued momentum and market share gain delivered mid-single digit top- and bottom-line growth
-
Operating performance:
- 4Q25: Revenue increased by mid-single digits with revenue per hl growth of mid-single digits, driven by revenue management and premiumization. Volumes grew by low-single digits, estimated to be in-line with the beer and Beyond Beer industry. EBITDA grew by low-single digits.
- FY25: Revenue increased by mid-single digits with revenue per hl growth of low-single digits. Volumes grew by low-single digits, estimated to have outperformed the industry in both beer and Beyond Beer. EBITDA grew by mid-single digits.
- Commercial highlights: Both the beer and Beyond Beer categories continued to grow and gain share of alcohol beverages this year according to our estimates. The momentum of our business continued, with focused investments in our megabrands increasing the brand power of our portfolio. Our performance was led by our premium and super premium beer brands, which grew volumes by mid-teens. In Beyond Beer, our portfolio grew volumes by high-single digits led by Flying Fish and our spirits-based RTD innovations.
China: Top- and bottom-line declined, impacted by volume performance
-
Operating performance:
- 4Q25: Volumes declined by 3.9%, estimated to be in-line with a soft industry which was impacted by shipment phasing from a later Chinese New Year. Revenue per hl declined by 7.7%, driven by increased investments to expand our in-home presence, resulting in a revenue decline of 11.3%. EBITDA declined by 38.7%, impacted by top-line performance.
- FY25: Volumes declined by 8.6%. Revenue per hl decreased by 3.0% resulting in a revenue decline of 11.3%. EBITDA declined by 14.7%.
- Commercial highlights: The beer industry showed signs of stabilization in FY25 with volumes estimated to have declined by low-single digits. Our FY25 results in China were below our potential as we adjusted inventory levels to better reflect the channel and geographic shifts in the industry and worked towards better positioning our business to participate in the growth areas. In 4Q25, we estimate our market share trend improved to be flat versus 4Q24, driven by improvements in Budweiser brand power and in-home channel performance. As we move forward, we are focused on rebuilding momentum and reigniting growth. To achieve this, we will continue to invest in our portfolio, innovation and mega platform activations, enhancing our route to market in the in-home channel, and expanding our footprint through targeted geographic expansion. In FY25, we expanded innovations in brands, such as the national rollout of Budweiser Magnum, and in packaging, such as the launch of the 1 liter can and the Corona full-open lid can.
Highlights from our other markets
- Canada: Revenue and revenue per hl increased by low-single digits in both 4Q25 and FY25. Our volumes were estimated to have outperformed the industry in beer and Beyond Beer, declining by low-single digits in both 4Q25 and FY25. Our beer performance was led by Busch and Michelob Ultra which were the top two share gainers in the industry in FY25. Beyond Beer growth was led by Cutwater and Mike’s Hard Lemonade which were both in the top five share gainers in the category.
- Peru: Revenue grew by mid-single digits in 4Q25 with low-single digit revenue per hl growth. Volumes grew by mid-single digits. In FY25, revenue increased by mid-single digits with mid-single digit revenue per hl growth. Volumes increased by low-single digits, with our performance led by our above core beer portfolio which grew volume by low-teens.
- Ecuador: Revenue grew by mid-single digits in both 4Q25 and FY25 with performance led by our above core beer brands which grew revenues by double-digits in both the quarter and full year. Volumes increased by high-single digits in 4Q25 and by low-single digits in FY25.
- Argentina: Volume declined by mid-single digits in 4Q25 and FY25, estimated to have underperformed the industry, as overall consumer demand continued to be impacted by inflationary pressures. Since 1Q24, the definition of organic revenue growth in Argentina has been amended to cap the price growth to a maximum of 2% per month. Revenue grew by high-single digits in 4Q25 and by mid-teens in FY25 on this basis.
-
Africa excluding South Africa: In Nigeria, revenue was flattish in 4Q25 and increased by mid-twenties in FY25, driven by revenue management in a highly inflationary environment. Beer volumes declined by mid-teens in 4Q25 and FY25, impacted by a soft industry.
In our other markets in Africa, revenue grew in aggregate by low-teens and volumes by low-single digits in both 4Q25 and FY25. Performance was led by growth in Mozambique, Tanzania and Uganda, with our businesses in Mozambique and Zambia reaching their highest market share in the last five years. - South Korea: Revenue was flattish in 4Q25 with mid-single digit revenue per hl growth driven by revenue management. Volumes declined by mid-single digits in 4Q25 and by low-single digits in FY25, estimated to have outperformed a soft industry in both the quarter and full year. Revenue increased by low-single digits in FY25 with low-single digit revenue per hl growth.
Consolidated Income Statement
|
Figure 3. Consolidated income statement |
|||||||||
|
in USD Mio |
4Q24 |
4Q25 |
Organic |
||||||
|
growth |
|||||||||
|
Revenue |
14 841 |
|
15 555 |
|
2.5 |
% |
|||
|
Cost of sales |
(6 645 |
) |
(6 943 |
) |
(2.6 |
)% |
|||
|
Gross profit |
8 197 |
|
8 613 |
|
2.5 |
% |
|||
|
SG&A |
(4 603 |
) |
(4 786 |
) |
(1.2 |
)% |
|||
|
Other operating income/(expenses) |
231 |
|
223 |
|
10.5 |
% |
|||
|
Normalized EBIT |
3 824 |
|
4 049 |
|
4.5 |
% |
|||
|
Non-underlying items above EBIT |
269 |
|
(410 |
) |
|||||
|
Net finance income/(expense) |
(958 |
) |
(1 070 |
) |
|||||
|
Non-underlying net finance income/(expense) |
(701 |
) |
395 |
|
|||||
|
Share of results of associates |
103 |
|
133 |
|
|||||
|
Non-underlying share of results of associates |
- |
|
- |
|
|||||
|
Income tax expense |
(848 |
) |
(720 |
) |
|||||
|
Profit |
1 691 |
|
2 377 |
|
|||||
|
Profit attributable to non-controlling interest |
471 |
|
418 |
|
|||||
|
Profit attributable to equity holders of AB InBev |
1 220 |
|
1 959 |
|
|||||
|
Normalized EBITDA |
5 245 |
|
5 473 |
|
2.3 |
% |
|||
|
Underlying Profit |
1 770 |
|
1 884 |
|
|
||||
|
FY24 |
FY25 |
Organic |
|||||||
|
growth |
|||||||||
|
Revenue |
59 768 |
|
59 320 |
|
2.0 |
% |
|||
|
Cost of sales |
(26 744 |
) |
(26 141 |
) |
(0.2 |
)% |
|||
|
Gross profit |
33 024 |
|
33 179 |
|
3.4 |
% |
|||
|
SG&A |
(18 341 |
) |
(18 133 |
) |
(0.7 |
)% |
|||
|
Other operating income/(expenses) |
779 |
|
808 |
|
10.6 |
% |
|||
|
Normalized EBIT |
15 462 |
|
15 854 |
|
7.0 |
% |
|||
|
Non-underlying items above EBIT |
25 |
|
(449 |
) |
|||||
|
Net finance income/(expense) |
(4 358 |
) |
(4 280 |
) |
|||||
|
Non-underlying net finance income/(expense) |
(995 |
) |
(185 |
) |
|||||
|
Share of results of associates |
329 |
|
378 |
|
|||||
|
Non-underlying share of results of associates |
104 |
|
9 |
|
|||||
|
Income tax expense |
(3 152 |
) |
(2 850 |
) |
|||||
|
Profit |
7 416 |
|
8 477 |
|
|||||
|
Profit attributable to non-controlling interest |
1 561 |
|
1 640 |
|
|||||
|
Profit attributable to equity holders of AB InBev |
5 855 |
|
6 837 |
|
|||||
|
Normalized EBITDA |
20 958 |
|
21 223 |
|
4.9 |
% |
|||
|
Underlying Profit |
7 061 |
|
7 410 |
|
|
||||
Non-underlying items above EBIT & Non-underlying share of results of associates
|
Figure 4. Non-underlying items above EBIT & Non-underlying share of results of associates |
||||||||||||
|
in USD Mio |
4Q24 |
4Q25 |
FY24 |
FY25 |
||||||||
|
Restructuring |
(60 |
) |
(48 |
) |
(156 |
) |
(116 |
) |
||||
|
Business and asset disposals (including impairment losses) |
329 |
|
(322 |
) |
181 |
|
(274 |
) |
||||
|
Claims and legal costs |
- |
|
(35 |
) |
- |
|
(53 |
) |
||||
|
Acquisition-related costs (business combinations) |
- |
|
(5 |
) |
- |
|
(5 |
) |
||||
|
Non-underlying items in EBIT |
269 |
|
(410 |
) |
25 |
|
(449 |
) |
||||
|
Non-underlying share of results of associates |
- |
|
- |
|
104 |
|
9 |
|
||||
Normalized EBIT excludes negative non-underlying items of 410 million USD in 4Q25 and 449 million USD in FY25.
Business and asset disposals (including impairment losses) for FY25 mainly comprised a loss of 214 million USD related to the planned sale of the Newark brewery and the closure of two other breweries in the United States and 60 million USD net loss related to the disposal of assets held for sale in Barbados and other Caribbean islands and the sale and impairment of non-core assets.
Non-underlying share of results from associates of FY24 included the impact from our associate Anadolu Efes’ adoption of IAS 29 hyperinflation accounting on their 2023 results.
Net finance income/(expense)
|
Figure 5. Net finance income/(expense) |
||||||||||||
|
in USD Mio |
4Q24 |
4Q25 |
FY24 |
FY25 |
||||||||
|
Net interest expense |
(620 |
) |
(607 |
) |
(2 704 |
) |
(2 566 |
) |
||||
|
Accretion expense and interest on pensions |
(199 |
) |
(241 |
) |
(811 |
) |
(821 |
) |
||||
|
Other financial results |
(139 |
) |
(221 |
) |
(843 |
) |
(893 |
) |
||||
|
Net finance income/(expense) |
(958 |
) |
(1 070 |
) |
(4 358 |
) |
(4 280 |
) |
||||
Non-underlying net finance income/(expense)
|
Figure 6. Non-underlying net finance income/(expense) |
|||||||||||
|
in USD Mio |
4Q24 |
4Q25 |
FY24 |
FY25 |
|||||||
|
Mark-to-market |
(940 |
) |
395 |
(1 211 |
) |
(213 |
) |
||||
|
Gain/(loss) on bond redemption and other |
239 |
|
- |
216 |
|
28 |
|
||||
|
Non-underlying net finance income/(expense) |
(701 |
) |
395 |
(995 |
) |
(185 |
) |
||||
Non-underlying net finance expense in FY25 includes mark-to-market losses on derivative instruments entered into in order to hedge our share-based payment programs and shares issued in relation to the combination with Grupo Modelo and SAB.
The number of shares covered by the hedging of our share-based payment program, the deferred share instrument and the restricted shares are shown below, together with the opening and closing share prices.
|
Figure 7. Non-underlying equity derivative instruments |
||||||||
|
4Q24 |
4Q25 |
FY24 |
FY25 |
|||||
|
Share price at the start of the period (Euro) |
59.38 |
50.80 |
58.42 |
48.25 |
||||
|
Share price at the end of the period (Euro) |
48.25 |
54.90 |
48.25 |
54.90 |
||||
|
Number of equity derivative instruments at the end of the period (in million) |
100.5 |
100.5 |
100.5 |
100.5 |
||||
Income tax expense
|
Figure 8. Income tax expense |
||||||||
|
in USD Mio |
4Q24 |
4Q25 |
FY24 |
FY25 |
||||
|
Income tax expense |
848 |
720 |
3 152 |
2 850 |
||||
|
Effective tax rate |
34.8% |
24.3% |
31.1% |
26.1% |
||||
|
Normalized effective tax rate |
26.4% |
27.5% |
26.5% |
26.0% |
||||
The 4Q24, FY24 and FY25 effective tax rates were negatively impacted by non-deductible losses from derivatives related to the hedging of share-based payment programs and of the shares issued in a transaction related to the combinations with Grupo Modelo and SAB, while the 4Q25 effective tax rate was positively impacted by non-taxable gains from these derivatives.
Furthermore, the FY25 effective tax rate included 156 million USD of non-underlying tax income, while the FY24 effective tax rate included 205 million USD of non-underlying tax expense. The difference in Normalized ETR in 4Q25 and FY25 compared to 4Q24 and FY24 was primarily due to country mix.
Underlying EPS
|
Figure 9. Underlying EPS |
||||||||||||
|
in USD per share, except number of shares in million |
4Q24 |
4Q25 |
FY24 |
FY25 |
||||||||
|
Normalized EBITDA |
2.62 |
|
2.76 |
|
10.46 |
|
10.70 |
|
||||
|
Depreciation, amortization and impairment |
(0.71 |
) |
(0.72 |
) |
(2.74 |
) |
(2.71 |
) |
||||
|
Normalized EBIT |
1.91 |
|
2.04 |
|
7.72 |
|
7.99 |
|
||||
|
Net finance income/(expense) |
(0.48 |
) |
(0.54 |
) |
(2.18 |
) |
(2.16 |
) |
||||
|
Income tax expense |
(0.38 |
) |
(0.41 |
) |
(1.47 |
) |
(1.52 |
) |
||||
|
Associates & non-controlling interests |
(0.18 |
) |
(0.15 |
) |
(0.62 |
) |
(0.62 |
) |
||||
|
Hyperinflation impacts |
0.02 |
|
0.01 |
|
0.07 |
|
0.04 |
|
||||
|
Underlying EPS |
0.88 |
|
0.95 |
|
3.53 |
|
3.73 |
|
||||
|
Weighted average number of ordinary and restricted shares |
2 003 |
|
1 984 |
|
2 003 |
|
1 984 |
|
||||
Reconciliation of IFRS and Non-IFRS Financial Measures
Profit attributable to equity holders and Underlying Profit
|
Figure 10. Underlying Profit |
|||||||||
|
in USD Mio |
4Q24 |
4Q25 |
FY24 |
FY25 |
|||||
|
Profit attributable to equity holders of AB InBev |
1 220 |
1 959 |
|
5 855 |
6 837 |
||||
|
Net impact of non-underlying items on profit |
520 |
(94 |
) |
1 062 |
499 |
||||
|
Hyperinflation impacts |
31 |
20 |
|
145 |
74 |
||||
|
Underlying Profit |
1 770 |
1 884 |
|
7 061 |
7 410 |
||||
Basic and Underlying EPS
|
Figure 11. Basic and Underlying EPS |
|||||||||
|
in USD per share, except number of shares in million |
4Q24 |
4Q25 |
FY24 |
FY25 |
|||||
|
Basic EPS |
0.61 |
0.99 |
|
2.92 |
3.45 |
||||
|
Net impact of non-underlying items |
0.26 |
(0.05 |
) |
0.53 |
0.25 |
||||
|
Hyperinflation impacts |
0.02 |
0.01 |
|
0.07 |
0.04 |
||||
|
Underlying EPS |
0.88 |
0.95 |
|
3.53 |
3.73 |
||||
|
FX translation impact |
- |
(0.05 |
) |
- |
0.13 |
||||
|
Underlying EPS in constant currency |
0.88 |
0.90 |
|
3.53 |
3.86 |
||||
|
Weighted average number of ordinary and restricted shares |
2 003 |
1 984 |
|
2 003 |
1 984 |
||||
Profit attributable to equity holders and Normalized EBITDA
|
Figure 12. Reconciliation of Normalized EBITDA to Profit attributable to equity holders of AB InBev |
||||||||||||
|
in USD Mio |
4Q24 |
4Q25 |
FY24 |
FY25 |
||||||||
|
Profit attributable to equity holders of AB InBev |
1 220 |
|
1 959 |
|
5 855 |
|
6 837 |
|
||||
|
Non-controlling interests |
471 |
|
418 |
|
1 561 |
|
1 640 |
|
||||
|
Profit |
1 691 |
|
2 377 |
|
7 416 |
|
8 477 |
|
||||
|
Income tax expense |
848 |
|
720 |
|
3 152 |
|
2 850 |
|
||||
|
Share of result of associates |
(103 |
) |
(133 |
) |
(329 |
) |
(378 |
) |
||||
|
Non-underlying share of results of associates |
- |
|
- |
|
(104 |
) |
(9 |
) |
||||
|
Net finance (income)/expense |
958 |
|
1 070 |
|
4 358 |
|
4 280 |
|
||||
|
Non-underlying net finance (income)/expense |
701 |
|
(395 |
) |
995 |
|
185 |
|
||||
|
Non-underlying items above EBIT (incl. impairment losses) |
(269 |
) |
410 |
|
(25 |
) |
449 |
|
||||
|
Normalized EBIT |
3 824 |
|
4 049 |
|
15 462 |
|
15 854 |
|
||||
|
Depreciation, amortization and impairment |
1 421 |
|
1 424 |
|
5 496 |
|
5 369 |
|
||||
|
Normalized EBITDA |
5 245 |
|
5 473 |
|
20 958 |
|
21 223 |
|
||||
Normalized EBITDA, Normalized EBIT and Underlying Profit are non-IFRS financial measures used by AB InBev to reflect the company’s underlying performance. Underlying EPS and constant currency Underlying EPS are non-IFRS financial measures that AB InBev believes are useful to investors because they facilitate comparisons of EPS from period to period.
Normalized EBITDA is calculated by adjusting profit attributable to equity holders of AB InBev to exclude: (i) non-controlling interest; (ii) income tax expense; (iii) share of results of associates; (iv) non-underlying share of results of associates; (v) net finance income or cost; (vi) non-underlying net finance income or cost; (vii) non-underlying items above EBIT; and (viii) depreciation, amortization and impairment.
Underlying Profit is calculated by adjusting profit attributable to equity holders of AB InBev to exclude: (i) non-underlying items and (ii) hyperinflation impacts. Underlying EPS is calculated as Underlying Profit divided by the weighted average number of ordinary and restricted shares. Constant currency Underlying EPS is calculated as Underlying EPS excluding the effects of foreign currency translation by translating current period figures using the exchange rates from the same period in the prior year.
Normalized EBITDA, Normalized EBIT and Underlying Profit are not accounting measures under IFRS and should not be considered as an alternative to profit attributable to equity holders as a measure of operational performance, or an alternative to cash flow as a measure of liquidity. Underlying EPS and constant currency Underlying EPS are not accounting measures under IFRS and should not be considered as alternatives to earnings per share as a measure of operating performance on a per share basis. These non-IFRS financial measures do not have a standard calculation method and AB InBev’s definition of Normalized EBITDA, Normalized EBIT, Underlying Profit, Underlying EPS and constant currency Underlying EPS may not be comparable to that of other companies.
Cash Flows and Financial position
|
Figure 13. Cash Flow Statement (million USD) |
||||||
|
FY24 |
FY25 |
|||||
|
Operating activities |
||||||
|
Profit of the period |
7 416 |
|
8 477 |
|
||
|
Interest, taxes and non-cash items included in profit |
13 990 |
|
13 160 |
|
||
|
Cash flow from operating activities before changes in working capital and use of provisions |
21 406 |
|
21 637 |
|
||
|
|
||||||
|
Change in working capital |
(22 |
) |
(398 |
) |
||
|
Pension contributions and use of provisions |
(374 |
) |
(426 |
) |
||
|
Interest and taxes (paid)/received |
(6 189 |
) |
(6 126 |
) |
||
|
Dividends received |
234 |
|
195 |
|
||
|
Cash flow from/(used in) operating activities |
15 055 |
|
14 883 |
|
||
|
|
||||||
|
Investing activities |
||||||
|
Net capex |
(3 735 |
) |
(3 552 |
) |
||
|
Sale/(acquisition) of subsidiaries, net of cash |
(46 |
) |
18 |
|
||
|
Net proceeds from sale/(acquisition) of other assets |
523 |
|
98 |
|
||
|
Cash flow from/(used in) investing activities |
(3 259 |
) |
(3 436 |
) |
||
|
|
||||||
|
Financing activities |
||||||
|
Net (repayments of) / proceeds from borrowings |
(3 830 |
) |
(2 460 |
) |
||
|
Dividends paid |
(2 672 |
) |
(4 543 |
) |
||
|
Share buyback |
(937 |
) |
(2 301 |
) |
||
|
Payment of lease liabilities |
(787 |
) |
(733 |
) |
||
|
Derivative financial instruments |
(431 |
) |
(206 |
) |
||
|
Sale/(acquisition) of non-controlling interests |
(435 |
) |
(323 |
) |
||
|
Other financing cash flows |
(763 |
) |
(883 |
) |
||
|
Cash flow from/(used in) financing activities |
(9 854 |
) |
(11 450 |
) |
||
|
|
||||||
|
Net increase/(decrease) in cash and cash equivalents |
1 942 |
|
(3 |
) |
||
Our free cash flow (defined as cash flow from operating activities less net capex) amounted to 11 331 million USD in FY25, in-line with FY24. Our cash and cash equivalents decreased by 3 million USD in FY25, compared to an increase of 1 942 million USD in FY24, with the following movements:
- Our cash flow from operating activities reached 14 883 million USD in FY25 compared to 15 055 million USD in FY24. The decrease was driven primarily by working capital movements.
- Our cash outflow from investing activities was 3 436 million USD in FY25 compared to a cash outflow of 3 259 million USD in FY24, with FY24 positively impacted by proceeds from the sale of our share in associate Ghost Beverages LLC. Out of the total FY25 capital expenditures, approximately 26% was used to improve the company’s production facilities while 50% was used for logistics and commercial investments and 24% was used for improving administrative capabilities and for the purchase of hardware and software.
- Our cash outflow from financing activities amounted to 11 450 million USD in FY25, as compared to a cash outflow of 9 854 million USD in FY24. The increase in the cash outflow versus FY24 was primarily driven by higher dividends paid, and increased cash outflow for share buybacks.
Our net debt increased to 60.9 billion USD as of 31 December 2025 from 60.6 billion USD as of 31 December 2024. Our net debt to normalized EBITDA ratio was 2.87x as of 31 December 2025. Our optimal capital structure is a net debt to normalized EBITDA ratio of around 2x.
We continue to proactively manage our debt portfolio. After bond repurchases and redemptions of 6 billion USD and issuances of 3.2 billion Euro in FY25, 98% of our bond portfolio holds a fixed-interest rate, 51% is denominated in currencies other than USD and maturities are well-distributed across the next several years.
As of 31 December 2025, we had total liquidity of 22.0 billion USD, which consisted of 11.9 billion USD of cash, cash equivalents and short-term investments in debt securities less bank overdrafts and 10.1 billion USD available under committed long-term credit facilities.
Proposed final dividend for the fiscal year 2025
The AB InBev Board of Directors proposes a final dividend of 1.00 EUR per share, subject to approval by the General Meeting of Shareholders to be held on 29 April 2026. In line with the Company’s financial discipline and deleveraging objectives, the proposed final dividend balances the Company’s capital allocation priorities and dividend policy while returning cash to shareholders. A timeline showing the ex-dividend, record and payment dates can be found below:
|
Dividend timeline |
||||||
|
Ex-dividend date |
Record Date |
Payment date |
||||
|
Euronext |
7 May 2026 |
8 May 2026 |
11 May 2026 |
|||
|
MEXBOL |
7 May 2026 |
8 May 2026 |
11 May 2026 |
|||
|
JSE |
6 May 2026 |
8 May 2026 |
11 May 2026 |
|||
|
NYSE (ADR program) |
8 May 2026 |
8 May 2026 |
5 June 2026 |
|||
|
Restricted Shares |
7 May 2026 |
8 May 2026 |
11 May 2026 |
|||
Recent Events
Re-acquisition of minority stake in US-based Metal Container Plants
On 30 January 2026, AB InBev announced the completion of the re-acquisition of the 49.9% minority stake in AB InBev’s US-based metal container plants from a consortium of institutional investors led and/or advised by affiliates of Apollo Global Management, Inc. (NYSE: APO) for approximately 2.9 billion USD. AB InBev previously announced it had exercised its right to reacquire this minority stake in a Press Release dated January 6th.
Notes
To facilitate the understanding of AB InBev’s underlying performance, the analyses of growth, including all comments in this press release, unless otherwise indicated, are based on organic growth and normalized numbers. In other words, financials are analyzed eliminating the impact of changes in currencies on translation of foreign operations, and scope changes. Since 1Q24, the definition of organic revenue growth has been amended to cap the price growth in Argentina to a maximum of 2% per month (26.8% year-over-year). Corresponding adjustments are made to all income statement related items in the organic growth calculations through scope changes. Scope changes also represent the impact of acquisitions and divestitures, the start or termination of activities or the transfer of activities between segments, curtailment gains and losses and year over year changes in accounting estimates and other assumptions that management does not consider as part of the underlying performance of the business. The organic growth of our global brands, Budweiser, Stella Artois, and Corona excludes exports to Australia for which a perpetual license was granted to a third party upon disposal of the Australia operations in 2020. All references per hectoliter (per hl) exclude US non-beverage activities. Whenever presented in this document, all performance measures (EBITDA, EBIT, profit, tax rate, EPS) are presented on a “normalized” basis, which means they are presented before non-underlying items. Non-underlying items are either income or expenses which do not occur regularly as part of the normal activities of the Company. They are presented separately because they are important for the understanding of the underlying sustainable performance of the Company due to their size or nature. Normalized measures are additional measures used by management and should not replace the measures determined in accordance with IFRS as an indicator of the Company’s performance. We are reporting the results from Argentina applying hyperinflation accounting since 3Q18. The IFRS rules (IAS 29) require us to restate the year-to-date results for the change in the general purchasing power of the local currency, using official indices before converting the local amounts at the closing rate of the period. In FY25, we reported a negative impact from hyperinflation accounting on the profit attributable to equity holders of AB InBev of 74 million USD. The impact in FY25 Basic EPS was (0.04) USD. Values in the figures and annexes may not add up, due to rounding. 4Q25 and FY25 EPS is based upon a weighted average of 1 984 million shares compared to a weighted average of 2 003 million shares for 4Q24 and FY24.
Legal disclaimer
This release contains “forward-looking statements”. These statements are based on the current expectations and views of future events and developments of the management of AB InBev and are naturally subject to uncertainty and changes in circumstances. The forward-looking statements contained in this release include statements other than historical facts and include statements typically containing words such as “will”, “may”, “should”, “believe”, “intends”, “expects”, “anticipates”, “targets”, “ambition”, “estimates”, “likely”, “foresees” and words of similar import. All statements other than statements of historical facts are forward-looking statements. You should not place undue reliance on these forward-looking statements, which reflect the current views of the management of AB InBev, are subject to numerous risks and uncertainties about AB InBev and are dependent on many factors, some of which are outside of AB InBev’s control. There are important factors, risks and uncertainties that could cause actual outcomes and results to be materially different, including, but not limited to the risks and uncertainties relating to AB InBev that are described under Item 3.D of AB InBev’s Annual Report on Form 20-F filed with the SEC on 12 March 2025. Many of these risks and uncertainties are, and will be, exacerbated by any further worsening of the global business and economic environment, including as a result of foreign currency exchange rate fluctuations and ongoing geopolitical instability. Other unknown or unpredictable factors could cause actual results to differ materially from those in the forward-looking statements. The forward-looking statements should be read in conjunction with the other cautionary statements that are included elsewhere, including AB InBev’s most recent Form 20-F and other reports furnished on Form 6-K, and any other documents that AB InBev has made public. Any forward-looking statements made in this communication are qualified in their entirety by these cautionary statements and there can be no assurance that the actual results or developments anticipated by AB InBev will be realized or, even if substantially realized, that they will have the expected consequences to, or effects on, AB InBev or its business or operations. Except as required by law, AB InBev undertakes no obligation to publicly update or revise any forward-looking statements, whether as a result of new information, future events or otherwise. The full year 2025 (FY25) financial data set out in Figure 1 (except for the volume information), Figures 3 to 6, 8, 10, 12 and 13 of this press release have been extracted from the group’s audited consolidated financial statements as of and for the twelve months ended 31 December 2025, which have been audited by our statutory auditors PwC Bedrijfsrevisoren BV/Réviseurs d’Entreprises SRL. The fourth quarter 2025 (4Q25) financial data set out in Figure 1 (except for the volume information), Figures 3 to 6, 8, 10 and 12, and the financial data included in Figures 7, 9, 11 and 14 of this press release have been extracted from the underlying accounting records as of and for the twelve months ended 31 December 2025. References in this document to materials on our websites, such as www.ab-inbev.com, are included as an aid to their location and are not incorporated by reference into this document.
Conference call and webcast
Investor Conference call and webcast on Thursday, 12 February 2026:
3.00pm Brussels / 2.00pm London / 9.00am New York
Registration details:
Webcast (listen-only mode):
AB InBev 4Q25 Results Webcast
To join by phone, please use one of the following two phone numbers:
Toll-Free: +1-877-407-8029
Toll: +1-201-689-8029
About AB InBev
Anheuser-Busch InBev (AB InBev) is a publicly traded company (Euronext: ABI) based in Leuven, Belgium, with secondary listings on the Mexico (MEXBOL: ANB) and South Africa (JSE: ANH) stock exchanges and with American Depositary Receipts on the New York Stock Exchange (NYSE: BUD). As a company, we dream big to create a future with more cheers. We are always looking to serve up new ways to meet life’s moments, move our industry forward and make a meaningful impact in the world. We are committed to building great brands that stand the test of time and to brewing the best beers using the finest ingredients. Beer is the drink for moderation, and for over a century, AB InBev has championed responsible drinking. We are committed to providing our consumers with balanced choices to enjoy on any occasion. We also invest in marketing that aims to reinforce positive behaviors, and we work with communities, customers, and partners to promote responsible consumption through evidence-based initiatives.
Our diverse portfolio of well over 400 beer brands includes global brands Budweiser®, Corona®, Stella Artois® and Michelob Ultra®; multi-country brands Beck’s®, Hoegaarden® and Leffe®; and local champions such as Aguila®, Antarctica®, Bud Light®, Brahma®, Cass®, Castle®, Castle Lite®, Cristal®, Harbin®, Jupiler®, Modelo Especial®, Quilmes®, Victoria®, Sedrin®, and Skol®. Our brewing heritage dates back more than 600 years, spanning continents and generations. From our European roots at the Den Hoorn brewery in Leuven, Belgium. To the pioneering spirit of the Anheuser & Co brewery in St. Louis, US. To the creation of the Castle Brewery in South Africa during the Johannesburg gold rush. To Bohemia, the first brewery in Brazil. Geographically diversified with a balanced exposure to developed and developing markets, we leverage the collective strengths of approximately 137 000 colleagues based in more than 40 countries worldwide. For 2025, AB InBev’s reported revenue was 59.3 billion USD (excluding JVs and associates).
Annex 1: Segment reporting (4Q)
|
AB InBev Worldwide |
4Q24 |
Scope |
Currency Translation |
Organic Growth |
4Q25 |
Organic Growth |
||||||||||||
|
Volumes |
141 829 |
|
(529 |
) |
- |
|
(2 135 |
) |
139 166 |
|
(1.5 |
)% |
||||||
|
Revenue |
14 841 |
|
(100 |
) |
441 |
|
373 |
|
15 555 |
|
2.5 |
% |
||||||
|
Cost of sales |
(6 645 |
) |
44 |
|
(173 |
) |
(168 |
) |
(6 943 |
) |
(2.6 |
)% |
||||||
|
Gross profit |
8 197 |
|
(56 |
) |
267 |
|
204 |
|
8 613 |
|
2.5 |
% |
||||||
|
SG&A |
(4 603 |
) |
(7 |
) |
(121 |
) |
(55 |
) |
(4 786 |
) |
(1.2 |
)% |
||||||
|
Other operating income/(expenses) |
231 |
|
(40 |
) |
12 |
|
19 |
|
223 |
|
10.5 |
% |
||||||
|
Normalized EBIT |
3 824 |
|
(103 |
) |
158 |
|
169 |
|
4 049 |
|
4.5 |
% |
||||||
|
Normalized EBITDA |
5 245 |
|
(94 |
) |
206 |
|
116 |
|
5 473 |
|
2.3 |
% |
||||||
|
Normalized EBITDA margin |
35.3 |
% |
35.2 |
% |
(10)bps |
|||||||||||||
|
|
||||||||||||||||||
|
North America |
4Q24 |
Scope |
Currency Translation |
Organic Growth |
4Q25 |
Organic Growth |
||||||||||||
|
Volumes |
19 516 |
|
(216 |
) |
- |
|
(681 |
) |
18 619 |
|
(3.5 |
)% |
||||||
|
Revenue |
3 331 |
|
(59 |
) |
(6 |
) |
(31 |
) |
3 235 |
|
(1.0 |
)% |
||||||
|
Cost of sales |
(1 483 |
) |
46 |
|
2 |
|
20 |
|
(1 416 |
) |
1.4 |
% |
||||||
|
Gross profit |
1 848 |
|
(12 |
) |
(4 |
) |
(12 |
) |
1 819 |
|
(0.6 |
)% |
||||||
|
SG&A |
(1 078 |
) |
(1 |
) |
2 |
|
(35 |
) |
(1 112 |
) |
(3.2 |
)% |
||||||
|
Other operating income/(expenses) |
8 |
|
- |
|
0 |
|
3 |
|
12 |
|
42.4 |
% |
||||||
|
Normalized EBIT |
777 |
|
(14 |
) |
(2 |
) |
(43 |
) |
719 |
|
(5.6 |
)% |
||||||
|
Normalized EBITDA |
969 |
|
(12 |
) |
(2 |
) |
(49 |
) |
906 |
|
(5.1 |
)% |
||||||
|
Normalized EBITDA margin |
29.1 |
% |
28.0 |
% |
(122)bps |
|||||||||||||
|
|
||||||||||||||||||
|
Middle Americas |
4Q24 |
Scope |
Currency Translation |
Organic Growth |
4Q25 |
Organic Growth |
||||||||||||
|
Volumes |
38 907 |
|
(300 |
) |
- |
|
1 065 |
|
39 672 |
|
2.8 |
% |
||||||
|
Revenue |
4 395 |
|
(34 |
) |
307 |
|
259 |
|
4 927 |
|
5.9 |
% |
||||||
|
Cost of sales |
(1 601 |
) |
8 |
|
(101 |
) |
(63 |
) |
(1 757 |
) |
(4.0 |
)% |
||||||
|
Gross profit |
2 794 |
|
(26 |
) |
206 |
|
195 |
|
3 170 |
|
7.0 |
% |
||||||
|
SG&A |
(975 |
) |
10 |
|
(71 |
) |
(10 |
) |
(1 045 |
) |
(1.1 |
)% |
||||||
|
Other operating income/(expenses) |
8 |
|
0 |
|
0 |
|
(3 |
) |
6 |
|
(35.2 |
)% |
||||||
|
Normalized EBIT |
1 828 |
|
(15 |
) |
136 |
|
182 |
|
2 130 |
|
10.0 |
% |
||||||
|
Normalized EBITDA |
2 227 |
|
(16 |
) |
159 |
|
138 |
|
2 508 |
|
6.2 |
% |
||||||
|
Normalized EBITDA margin |
50.7 |
% |
50.9 |
% |
13bps |
|||||||||||||
|
South America |
4Q24 |
Scope |
Currency Translation |
Organic Growth |
4Q25 |
Organic Growth |
||||||||||||
|
Volumes |
44 950 |
|
- |
|
- |
|
(1 791 |
) |
43 160 |
|
(4.0 |
)% |
||||||
|
Revenue |
3 473 |
|
(40 |
) |
36 |
|
175 |
|
3 645 |
|
5.0 |
% |
||||||
|
Cost of sales |
(1 558 |
) |
24 |
|
(18 |
) |
(160 |
) |
(1 711 |
) |
(10.3 |
)% |
||||||
|
Gross profit |
1 915 |
|
(15 |
) |
19 |
|
15 |
|
1 934 |
|
0.8 |
% |
||||||
|
SG&A |
(992 |
) |
(17 |
) |
(18 |
) |
25 |
|
(1 002 |
) |
2.5 |
% |
||||||
|
Other operating income/(expenses) |
133 |
|
(42 |
) |
9 |
|
25 |
|
124 |
|
31.3 |
% |
||||||
|
Normalized EBIT |
1 056 |
|
(75 |
) |
10 |
|
65 |
|
1 056 |
|
6.7 |
% |
||||||
|
Normalized EBITDA |
1 310 |
|
(64 |
) |
17 |
|
58 |
|
1 321 |
|
4.7 |
% |
||||||
|
Normalized EBITDA margin |
37.7 |
% |
36.2 |
% |
(12)bps |
|||||||||||||
|
EMEA |
4Q24 |
Scope |
Currency Translation |
Organic Growth |
4Q25 |
Organic Growth |
||||||||||||
|
Volumes |
24 883 |
|
(15 |
) |
- |
|
(619 |
) |
24 249 |
|
(2.5 |
)% |
||||||
|
Revenue |
2 424 |
|
(29 |
) |
123 |
|
6 |
|
2 524 |
|
0.2 |
% |
||||||
|
Cost of sales |
(1 276 |
) |
13 |
|
(66 |
) |
21 |
|
(1 308 |
) |
1.6 |
% |
||||||
|
Gross profit |
1 149 |
|
(16 |
) |
57 |
|
26 |
|
1 216 |
|
2.3 |
% |
||||||
|
SG&A |
(708 |
) |
9 |
|
(36 |
) |
(20 |
) |
(755 |
) |
(2.9 |
)% |
||||||
|
Other operating income/(expenses) |
51 |
|
3 |
|
3 |
|
18 |
|
75 |
|
33.0 |
% |
||||||
|
Normalized EBIT |
493 |
|
(5 |
) |
24 |
|
24 |
|
536 |
|
5.0 |
% |
||||||
|
Normalized EBITDA |
776 |
|
2 |
|
40 |
|
(2 |
) |
815 |
|
(0.3 |
)% |
||||||
|
Normalized EBITDA margin |
32.0 |
% |
32.3 |
% |
(17)bps |
|||||||||||||
|
|
||||||||||||||||||
|
Asia Pacific |
4Q24 |
Scope |
Currency Translation |
Organic Growth |
4Q25 |
Organic Growth |
||||||||||||
|
Volumes |
13 439 |
|
1 |
|
- |
|
(106 |
) |
13 334 |
|
(0.8 |
)% |
||||||
|
Revenue |
1 122 |
|
0 |
|
(21 |
) |
(48 |
) |
1 053 |
|
(4.3 |
)% |
||||||
|
Cost of sales |
(589 |
) |
(2 |
) |
10 |
|
14 |
|
(567 |
) |
2.3 |
% |
||||||
|
Gross profit |
533 |
|
(2 |
) |
(11 |
) |
(35 |
) |
486 |
|
(6.5 |
)% |
||||||
|
SG&A |
(484 |
) |
(0 |
) |
9 |
|
18 |
|
(457 |
) |
3.8 |
% |
||||||
|
Other operating income/(expenses) |
33 |
|
- |
|
- |
|
(21 |
) |
13 |
|
(62.5 |
)% |
||||||
|
Normalized EBIT |
83 |
|
(2 |
) |
(2 |
) |
(37 |
) |
42 |
|
(45.7 |
)% |
||||||
|
Normalized EBITDA |
244 |
|
1 |
|
(3 |
) |
(49 |
) |
192 |
|
(19.9 |
)% |
||||||
|
Normalized EBITDA margin |
21.7 |
% |
18.3 |
% |
(356)bps |
|||||||||||||
|
|
||||||||||||||||||
|
Global Export and Holding Companies |
4Q24 |
Scope |
Currency Translation |
Organic Growth |
4Q25 |
Organic Growth |
||||||||||||
|
Volumes |
135 |
|
- |
|
- |
|
(4 |
) |
131 |
|
(2.7 |
)% |
||||||
|
Revenue |
95 |
|
62 |
|
1 |
|
13 |
|
172 |
|
14.0 |
% |
||||||
|
Cost of sales |
(138 |
) |
(46 |
) |
(1 |
) |
1 |
|
(183 |
) |
0.9 |
% |
||||||
|
Gross profit |
(42 |
) |
16 |
|
1 |
|
15 |
|
(12 |
) |
34.3 |
% |
||||||
|
SG&A |
(367 |
) |
(7 |
) |
(8 |
) |
(33 |
) |
(415 |
) |
(9.5 |
)% |
||||||
|
Other operating income/(expenses) |
(3 |
) |
(0 |
) |
(1 |
) |
(4 |
) |
(7 |
) |
- |
|
||||||
|
Normalized EBIT |
(412 |
) |
8 |
|
(8 |
) |
(22 |
) |
(434 |
) |
(5.6 |
)% |
||||||
|
Normalized EBITDA |
(281 |
) |
(4 |
) |
(4 |
) |
21 |
|
(269 |
) |
7.6 |
% |
||||||
Annex 2: Segment reporting (FY)
|
AB InBev Worldwide |
FY24 |
Scope |
Currency Translation |
Organic Growth |
FY25 |
Organic Growth |
||||||||||||
|
Volumes |
575 706 |
|
(1 265 |
) |
- |
|
(13 341 |
) |
561 100 |
|
(2.3 |
)% |
||||||
|
Revenue |
59 768 |
|
(290 |
) |
(1 336 |
) |
1 178 |
|
59 320 |
|
2.0 |
% |
||||||
|
Cost of sales |
(26 744 |
) |
38 |
|
619 |
|
(54 |
) |
(26 141 |
) |
(0.2 |
)% |
||||||
|
Gross profit |
33 024 |
|
(251 |
) |
(717 |
) |
1 123 |
|
33 179 |
|
3.4 |
% |
||||||
|
SG&A |
(18 341 |
) |
(42 |
) |
383 |
|
(133 |
) |
(18 133 |
) |
(0.7 |
)% |
||||||
|
Other operating income/(expenses) |
779 |
|
(34 |
) |
(13 |
) |
77 |
|
808 |
|
10.6 |
% |
||||||
|
Normalized EBIT |
15 462 |
|
(328 |
) |
(347 |
) |
1 067 |
|
15 854 |
|
7.0 |
% |
||||||
|
Normalized EBITDA |
20 958 |
|
(319 |
) |
(441 |
) |
1 026 |
|
21 223 |
|
4.9 |
% |
||||||
|
Normalized EBITDA margin |
35.1 |
% |
35.8 |
% |
101bps |
|||||||||||||
|
North America |
FY24 |
Scope |
Currency Translation |
Organic Growth |
FY25 |
Organic Growth |
||||||||||||
|
Volumes |
86 272 |
|
(961 |
) |
- |
|
(2 577 |
) |
82 734 |
|
(3.0 |
)% |
||||||
|
Revenue |
14 655 |
|
(259 |
) |
(46 |
) |
(142 |
) |
14 207 |
|
(1.0 |
)% |
||||||
|
Cost of sales |
(6 236 |
) |
193 |
|
16 |
|
164 |
|
(5 863 |
) |
2.7 |
% |
||||||
|
Gross profit |
8 419 |
|
(66 |
) |
(31 |
) |
21 |
|
8 345 |
|
0.3 |
% |
||||||
|
SG&A |
(4 358 |
) |
(30 |
) |
16 |
|
(35 |
) |
(4 407 |
) |
(0.8 |
)% |
||||||
|
Other operating income/(expenses) |
7 |
|
- |
|
2 |
|
29 |
|
38 |
|
- |
|
||||||
|
Normalized EBIT |
4 069 |
|
(95 |
) |
(13 |
) |
15 |
|
3 975 |
|
0.4 |
% |
||||||
|
Normalized EBITDA |
4 791 |
|
(94 |
) |
(16 |
) |
6 |
|
4 687 |
|
0.1 |
% |
||||||
|
Normalized EBITDA margin |
32.7 |
% |
33.0 |
% |
37bps |
|||||||||||||
|
Middle Americas |
FY24 |
Scope |
Currency Translation |
Organic Growth |
FY25 |
Organic Growth |
||||||||||||
|
Volumes |
150 086 |
|
(351 |
) |
- |
|
755 |
|
150 490 |
|
0.5 |
% |
||||||
|
Revenue |
17 072 |
|
(53 |
) |
(451 |
) |
807 |
|
17 376 |
|
4.7 |
% |
||||||
|
Cost of sales |
(6 242 |
) |
(24 |
) |
162 |
|
(46 |
) |
(6 151 |
) |
(0.7 |
)% |
||||||
|
Gross profit |
10 830 |
|
(77 |
) |
(289 |
) |
761 |
|
11 225 |
|
7.1 |
% |
||||||
|
SG&A |
(3 976 |
) |
(0 |
) |
108 |
|
(36 |
) |
(3 904 |
) |
(0.9 |
)% |
||||||
|
Other operating income/(expenses) |
34 |
|
0 |
|
(1 |
) |
(13 |
) |
21 |
|
(36.4 |
)% |
||||||
|
Normalized EBIT |
6 889 |
|
(77 |
) |
(182 |
) |
712 |
|
7 342 |
|
10.4 |
% |
||||||
|
Normalized EBITDA |
8 400 |
|
(79 |
) |
(224 |
) |
588 |
|
8 685 |
|
7.0 |
% |
||||||
|
Normalized EBITDA margin |
49.2 |
% |
50.0 |
% |
108bps |
|||||||||||||
|
South America |
FY24 |
Scope |
Currency Translation |
Organic Growth |
FY25 |
Organic Growth |
||||||||||||
|
Volumes |
160 768 |
|
- |
|
- |
|
(5 597 |
) |
155 171 |
|
(3.5 |
)% |
||||||
|
Revenue |
12 423 |
|
(80 |
) |
(999 |
) |
610 |
|
11 954 |
|
4.9 |
% |
||||||
|
Cost of sales |
(6 073 |
) |
(46 |
) |
531 |
|
(300 |
) |
(5 888 |
) |
(4.9 |
)% |
||||||
|
Gross profit |
6 350 |
|
(126 |
) |
(468 |
) |
310 |
|
6 066 |
|
4.9 |
% |
||||||
|
SG&A |
(3 779 |
) |
(33 |
) |
317 |
|
(60 |
) |
(3 555 |
) |
(1.6 |
)% |
||||||
|
Other operating income/(expenses) |
452 |
|
(51 |
) |
(19 |
) |
44 |
|
426 |
|
11.6 |
% |
||||||
|
Normalized EBIT |
3 024 |
|
(210 |
) |
(170 |
) |
294 |
|
2 937 |
|
10.2 |
% |
||||||
|
Normalized EBITDA |
4 052 |
|
(195 |
) |
(251 |
) |
294 |
|
3 901 |
|
7.5 |
% |
||||||
|
Normalized EBITDA margin |
32.6 |
% |
32.6 |
% |
78bps |
|||||||||||||
|
EMEA |
FY24 |
Scope |
Currency Translation |
Organic Growth |
FY25 |
Organic Growth |
||||||||||||
|
Volumes |
93 804 |
|
147 |
|
- |
|
(629 |
) |
93 323 |
|
(0.7 |
)% |
||||||
|
Revenue |
9 003 |
|
(36 |
) |
250 |
|
284 |
|
9 502 |
|
3.2 |
% |
||||||
|
Cost of sales |
(4 678 |
) |
31 |
|
(128 |
) |
(56 |
) |
(4 832 |
) |
(1.2 |
)% |
||||||
|
Gross profit |
4 325 |
|
(4 |
) |
122 |
|
228 |
|
4 670 |
|
5.3 |
% |
||||||
|
SG&A |
(2 701 |
) |
(45 |
) |
(80 |
) |
(60 |
) |
(2 886 |
) |
(2.2 |
)% |
||||||
|
Other operating income/(expenses) |
177 |
|
17 |
|
7 |
|
33 |
|
234 |
|
17.2 |
% |
||||||
|
Normalized EBIT |
1 801 |
|
(32 |
) |
49 |
|
201 |
|
2 019 |
|
11.4 |
% |
||||||
|
Normalized EBITDA |
2 847 |
|
(26 |
) |
80 |
|
198 |
|
3 098 |
|
7.0 |
% |
||||||
|
Normalized EBITDA margin |
31.6 |
% |
32.6 |
% |
117bps |
|||||||||||||
|
Asia Pacific |
FY24 |
Scope |
Currency Translation |
Organic Growth |
FY25 |
Organic Growth |
||||||||||||
|
Volumes |
84 397 |
|
(91 |
) |
- |
|
(5 306 |
) |
78 999 |
|
(6.3 |
)% |
||||||
|
Revenue |
6 196 |
|
(6 |
) |
(92 |
) |
(404 |
) |
5 693 |
|
(6.5 |
)% |
||||||
|
Cost of sales |
(2 970 |
) |
(19 |
) |
42 |
|
205 |
|
(2 741 |
) |
6.9 |
% |
||||||
|
Gross profit |
3 227 |
|
(25 |
) |
(50 |
) |
(199 |
) |
2 952 |
|
(6.2 |
)% |
||||||
|
SG&A |
(2 059 |
) |
(13 |
) |
32 |
|
96 |
|
(1 944 |
) |
4.6 |
% |
||||||
|
Other operating income/(expenses) |
116 |
|
0 |
|
0 |
|
(30 |
) |
86 |
|
(26.2 |
)% |
||||||
|
Normalized EBIT |
1 284 |
|
(38 |
) |
(18 |
) |
(134 |
) |
1 094 |
|
(10.6 |
)% |
||||||
|
Normalized EBITDA |
1 933 |
|
(35 |
) |
(25 |
) |
(172 |
) |
1 700 |
|
(9.0 |
)% |
||||||
|
Normalized EBITDA margin |
31.2 |
% |
29.9 |
% |
(81)bps |
|||||||||||||
|
Global Export and Holding Companies |
FY24 |
Scope |
Currency Translation |
Organic Growth |
FY25 |
Organic Growth |
||||||||||||
|
Volumes |
380 |
|
(9 |
) |
- |
|
13 |
|
383 |
|
3.4 |
% |
||||||
|
Revenue |
418 |
|
144 |
|
3 |
|
23 |
|
588 |
|
6.1 |
% |
||||||
|
Cost of sales |
(546 |
) |
(98 |
) |
(3 |
) |
(21 |
) |
(667 |
) |
(4.1 |
)% |
||||||
|
Gross profit |
(128 |
) |
46 |
|
0 |
|
2 |
|
(79 |
) |
1.8 |
% |
||||||
|
SG&A |
(1 468 |
) |
79 |
|
(11 |
) |
(38 |
) |
(1 438 |
) |
(2.8 |
)% |
||||||
|
Other operating income/(expenses) |
(8 |
) |
- |
|
(2 |
) |
14 |
|
3 |
|
- |
|
||||||
|
Normalized EBIT |
(1 604 |
) |
125 |
|
(14 |
) |
(22 |
) |
(1 513 |
) |
(1.5 |
)% |
||||||
|
Normalized EBITDA |
(1 065 |
) |
110 |
|
(5 |
) |
111 |
|
(848 |
) |
11.6 |
% |
||||||
Annex 3: Consolidated statement of financial position (FY)
|
Million US dollar |
31 December 2024 |
31 December 2025 |
||
|
ASSETS |
||||
|
Non-current assets |
||||
|
Property, plant and equipment |
23 503 |
23 664 |
||
|
Goodwill |
110 479 |
117 908 |
||
|
Intangible assets |
40 034 |
41 985 |
||
|
Investments in associates |
4 612 |
5 002 |
||
|
Investment securities |
168 |
161 |
||
|
Deferred tax assets |
2 493 |
2 708 |
||
|
Pensions and similar obligations |
42 |
150 |
||
|
Income tax receivables |
470 |
444 |
||
|
Derivatives |
261 |
145 |
||
|
Trade and other receivables |
1 577 |
1 871 |
||
|
Total non-current assets |
183 637 |
194 039 |
||
|
Current assets |
||||
|
Investment securities |
221 |
306 |
||
|
Inventories |
5 020 |
5 107 |
||
|
Income tax receivables |
727 |
785 |
||
|
Derivatives |
554 |
583 |
||
|
Trade and other receivables |
5 270 |
6 161 |
||
|
Cash and cash equivalents |
11 174 |
11 638 |
||
|
Assets classified as held for sale |
33 |
190 |
||
|
Total current assets |
22 999 |
24 769 |
||
|
Total assets |
206 637 |
218 808 |
||
|
EQUITY AND LIABILITIES |
||||
|
Equity |
||||
|
Issued capital |
1 736 |
1 736 |
||
|
Share premium |
17 620 |
17 620 |
||
|
Reserves |
12 304 |
17 803 |
||
|
Retained earnings |
46 577 |
50 128 |
||
|
Equity attributable to equity holders of AB InBev |
78 237 |
87 287 |
||
|
Non-controlling interests |
10 463 |
10 449 |
||
|
Total equity |
88 700 |
97 736 |
||
|
Non-current liabilities |
||||
|
Interest-bearing loans and borrowings |
70 720 |
72 128 |
||
|
Pensions and similar obligations |
1 296 |
1 275 |
||
|
Deferred tax liabilities |
11 321 |
11 400 |
||
|
Income tax payables |
284 |
206 |
||
|
Derivatives |
68 |
293 |
||
|
Trade and other payables |
797 |
869 |
||
|
Provisions |
385 |
425 |
||
|
Total non-current liabilities |
84 871 |
86 596 |
||
|
Current liabilities |
||||
|
Bank overdrafts |
- |
14 |
||
|
Interest-bearing loans and borrowings |
1 449 |
885 |
||
|
Income tax payables |
1 805 |
1 825 |
||
|
Derivatives |
5 817 |
6 104 |
||
|
Trade and other payables |
23 804 |
25 455 |
||
|
Provisions |
191 |
192 |
||
|
Total current liabilities |
33 066 |
34 475 |
||
|
Total equity and liabilities |
206 637 |
218 808 |
Annex 4: Consolidated statement of cash flows (FY)
|
For the year ended 31 December |
||||||
|
Million US dollar |
2024 |
2025 |
||||
|
OPERATING ACTIVITIES |
||||||
|
Profit of the period |
7 416 |
|
8 477 |
|
||
|
Depreciation, amortization and impairment |
5 544 |
|
5 652 |
|
||
|
Net finance expense/(income) |
5 353 |
|
4 465 |
|
||
|
Equity-settled share-based payment expense |
644 |
|
625 |
|
||
|
Income tax expense |
3 152 |
|
2 850 |
|
||
|
Share of results of associates |
(433 |
) |
(387 |
) |
||
|
Other non-cash items |
(269 |
) |
(45 |
) |
||
|
Cash flow from operating activities before changes in working capital and use of provisions |
21 406 |
|
21 637 |
|
||
|
Decrease/(increase) in trade and other receivables |
341 |
|
(187 |
) |
||
|
Decrease/(increase) in inventories |
(149 |
) |
87 |
|
||
|
Increase/(decrease) in trade and other payables |
(215 |
) |
(298 |
) |
||
|
Pension contributions and use of provisions |
(374 |
) |
(426 |
) |
||
|
Cash generated from operations |
21 009 |
|
20 814 |
|
||
|
Interest paid |
(3 649 |
) |
(3 348 |
) |
||
|
Interest received |
594 |
|
462 |
|
||
|
Dividends received |
234 |
|
195 |
|
||
|
Income tax paid |
(3 134 |
) |
(3 240 |
) |
||
|
Cash flow from/(used in) operating activities |
15 055 |
|
14 883 |
|
||
|
INVESTING ACTIVITIES |
||||||
|
Acquisition of property, plant and equipment and of intangible assets |
(3 863 |
) |
(3 656 |
) |
||
|
Proceeds from sale of property, plant and equipment and of intangible assets |
128 |
|
104 |
|
||
|
Sale/(acquisition) of subsidiaries, net of cash |
(46 |
) |
18 |
|
||
|
Proceeds from sale/(acquisition) of other assets |
523 |
|
98 |
|
||
|
Cash flow from/(used in) investing activities |
(3 259 |
) |
(3 436 |
) |
||
|
FINANCING ACTIVITIES |
||||||
|
Proceeds from borrowings |
5 465 |
|
4 400 |
|
||
|
Repayments of borrowings |
(9 295 |
) |
(6 861 |
) |
||
|
Dividends paid |
(2 672 |
) |
(4 543 |
) |
||
|
Share buyback |
(937 |
) |
(2 301 |
) |
||
|
Payment of lease liabilities |
(787 |
) |
(733 |
) |
||
|
Derivative financial instruments |
(431 |
) |
(206 |
) |
||
|
Sale/(acquisition) of non-controlling interests |
(435 |
) |
(323 |
) |
||
|
Other financing cash flows |
(763 |
) |
(883 |
) |
||
|
Cash flow from/(used in) financing activities |
(9 854 |
) |
(11 450 |
) |
||
|
Net increase/(decrease) in cash and cash equivalents |
1 942 |
|
(3 |
) |
||
|
Cash and cash equivalents less bank overdrafts at beginning of year |
10 314 |
|
11 174 |
|
||
|
Effect of exchange rate fluctuations |
(1 082 |
) |
452 |
|
||
|
Cash and cash equivalents less bank overdrafts at end of period |
11 174 |
|
11 623 |
|
||
Contacts
Investors
Shaun Fullalove
E-mail: shaun.fullalove@ab-inbev.com
Ekaterina Baillie
E-mail: ekaterina.baillie@ab-inbev.com
Patrick Ryan
E-mail: patrick.ryan@ab-inbev.com
Media
Media Relations
E-mail: media.relations@ab-inbev.com
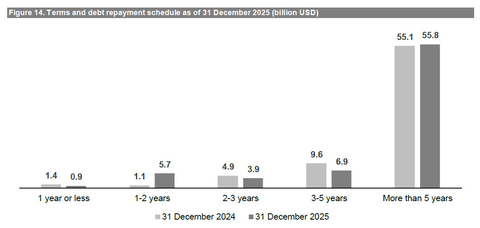
Figure 14. Terms and debt repayment schedule as of 31 December 2025 (billion USD)